The Landscape and Irrigation Guys, LLC

ANALYSIS OF A NORTHWEST ARKANSAS PREMIUM ESTATE PROPERTY · CUSTOMER INTERACTIVE PRESENTATION · APPROX. 8–10 MINUTES

Checking available voices…
Introduction

This Project Required Design Judgment, Not Just Installation Labor

This drainage proposal for a Northwest Arkansas Premium Estate was evaluated as a roof-runoff and site-water-management issue, not simply as a pipe-installation exercise. The work required an understanding of how rainfall reaches the home, how runoff accumulates, how gravity routing behaves across the property, and how to reduce the risk of expensive hidden failure after the trench is closed.

This presentation is intentionally structured for a homeowner: clear enough to understand, technical enough to be credible, and restrained enough not to hand over the full proprietary design package. It also reflects the design discipline and field judgment that position The Landscape and Irrigation Guys as the premier industry leader in Northwest Arkansas.
Customer-safe project overview
Customer-facing planning view showing the home, the runoff entry points, the discharge concept, and the broader drainage relationships considered during evaluation.
Real Northwest Arkansas Events

Observed Rainfall Dates From Public .gov and .org Sources

This slide establishes the real rainfall burden first. Before any installation discussion, the homeowner should understand that this project was checked against meaningful storm depth in the same units people actually remember: inches of rain.

Project design-storm basis

0.734 inches in 5 minutes, 2.76 inches in 60 minutes, and 6.29 inches in 24 hours from NOAA Atlas 14 for the Fayetteville / Lowell reference point. Those correspond to about 8.81 in/hr, 2.76 in/hr, and 0.262 in/hr average intensity, and across the 9,384.9 ft² pitch-adjusted roof model they translate to about 858.8 GPM / 1.913 CFS, 269.0 GPM / 0.599 CFS, and 25.6 GPM / 0.057 CFS average, respectively.

May 23, 2011 — FYV

Public station data recorded 3.07 inches in 1 hour — about 11.2% above the project’s 1-hour benchmark of 2.76 inches. On the full 9,384.9 ft² pitch-adjusted roof model, that hourly burden would equate to about 299.3 GPM or 0.667 CFS, with about 17,960.5 gallons or 2,401.0 cubic feet over the hour.

April 28, 2021 — XNA

Public station data recorded 2.05 inches in 1 hour, or about 74.3% of the project’s 1-hour benchmark. Even then, NOAA still logged flash flooding. On the full 9,384.9 ft² pitch-adjusted roof model, that hourly burden would still equate to about 199.9 GPM or 0.445 CFS, with about 11,993.2 gallons or 1,603.3 cubic feet over the hour.

December 27, 2015 — FYV

Public daily data recorded 6.49 inches in 24 hours, about 3.2% above the project’s 24-hour benchmark of 6.29 inches. Averaged over the day, that is about 0.270 in/hr; on the full 9,384.9 ft² pitch-adjusted roof model, it corresponds to about 26.4 GPM or 0.059 CFS average, totaling about 37,968.6 gallons or 5,075.7 cubic feet.

May 26, 2024 — NOAA / NCEI

The official event narrative states that four to five inches of rain fell, with most of it occurring between midnight and 4:30 a.m. — exactly how a homeowner remembers a storm. If averaged across that reported 4.5-hour window, that is about 0.889 to 1.111 in/hr, or roughly 86.7 to 108.3 GPM / 0.193 to 0.241 CFS across the full pitch-adjusted roof model.

What four to five inches means here

On Downspout #8’s 1,200.5 ft² pitch-adjusted roof area, 4.0 inches equals about 2,993.5 gallons or 400.2 cubic feet, and 5.0 inches equals about 3,741.8 gallons or 500.2 cubic feet. If those totals are averaged over the reported 4.5-hour event window, that is roughly 11.1 to 13.9 GPM or 0.025 to 0.031 CFS at that one downspout catchment. Across the entire pitch-adjusted modeled roof area, that same storm depth corresponds to about 23,401.3 to 29,251.6 gallons, or about 3,128.3 to 3,910.4 cubic feet; spread across 4.5 hours, that averages about 86.7 to 108.3 GPM or 0.193 to 0.241 CFS.

Why this slide comes early

These observed events ground the rest of the presentation in real storm depth, real property risk, and real homeowner consequences.

Scope of Evaluation

What Was Actually Considered Before Recommending a System

  • roof catchment interpretation by actual entry point
  • public rainfall-frequency data for the local area
  • grouped discharge strategy and accumulated burden
  • photo-informed roof-pitch adjustment by roof section
  • gravity feasibility, available fall, and route geometry
  • pipe-capacity checks and practical constructability
  • future flatwork crossings, access, and long-term serviceability
  • installation sequence and field-risk exposure
Simple takeaway: this proposal was evaluated as a complete drainage system, not as a guess built around trenching labor alone.
Detailed analysis view of route logic, loading, grouping, and installation consequences across the property
Internal planning dashboard: this image represents the level of route, loading, grouping, and constructability analysis used behind the recommendation.
Roof Catchment Logic

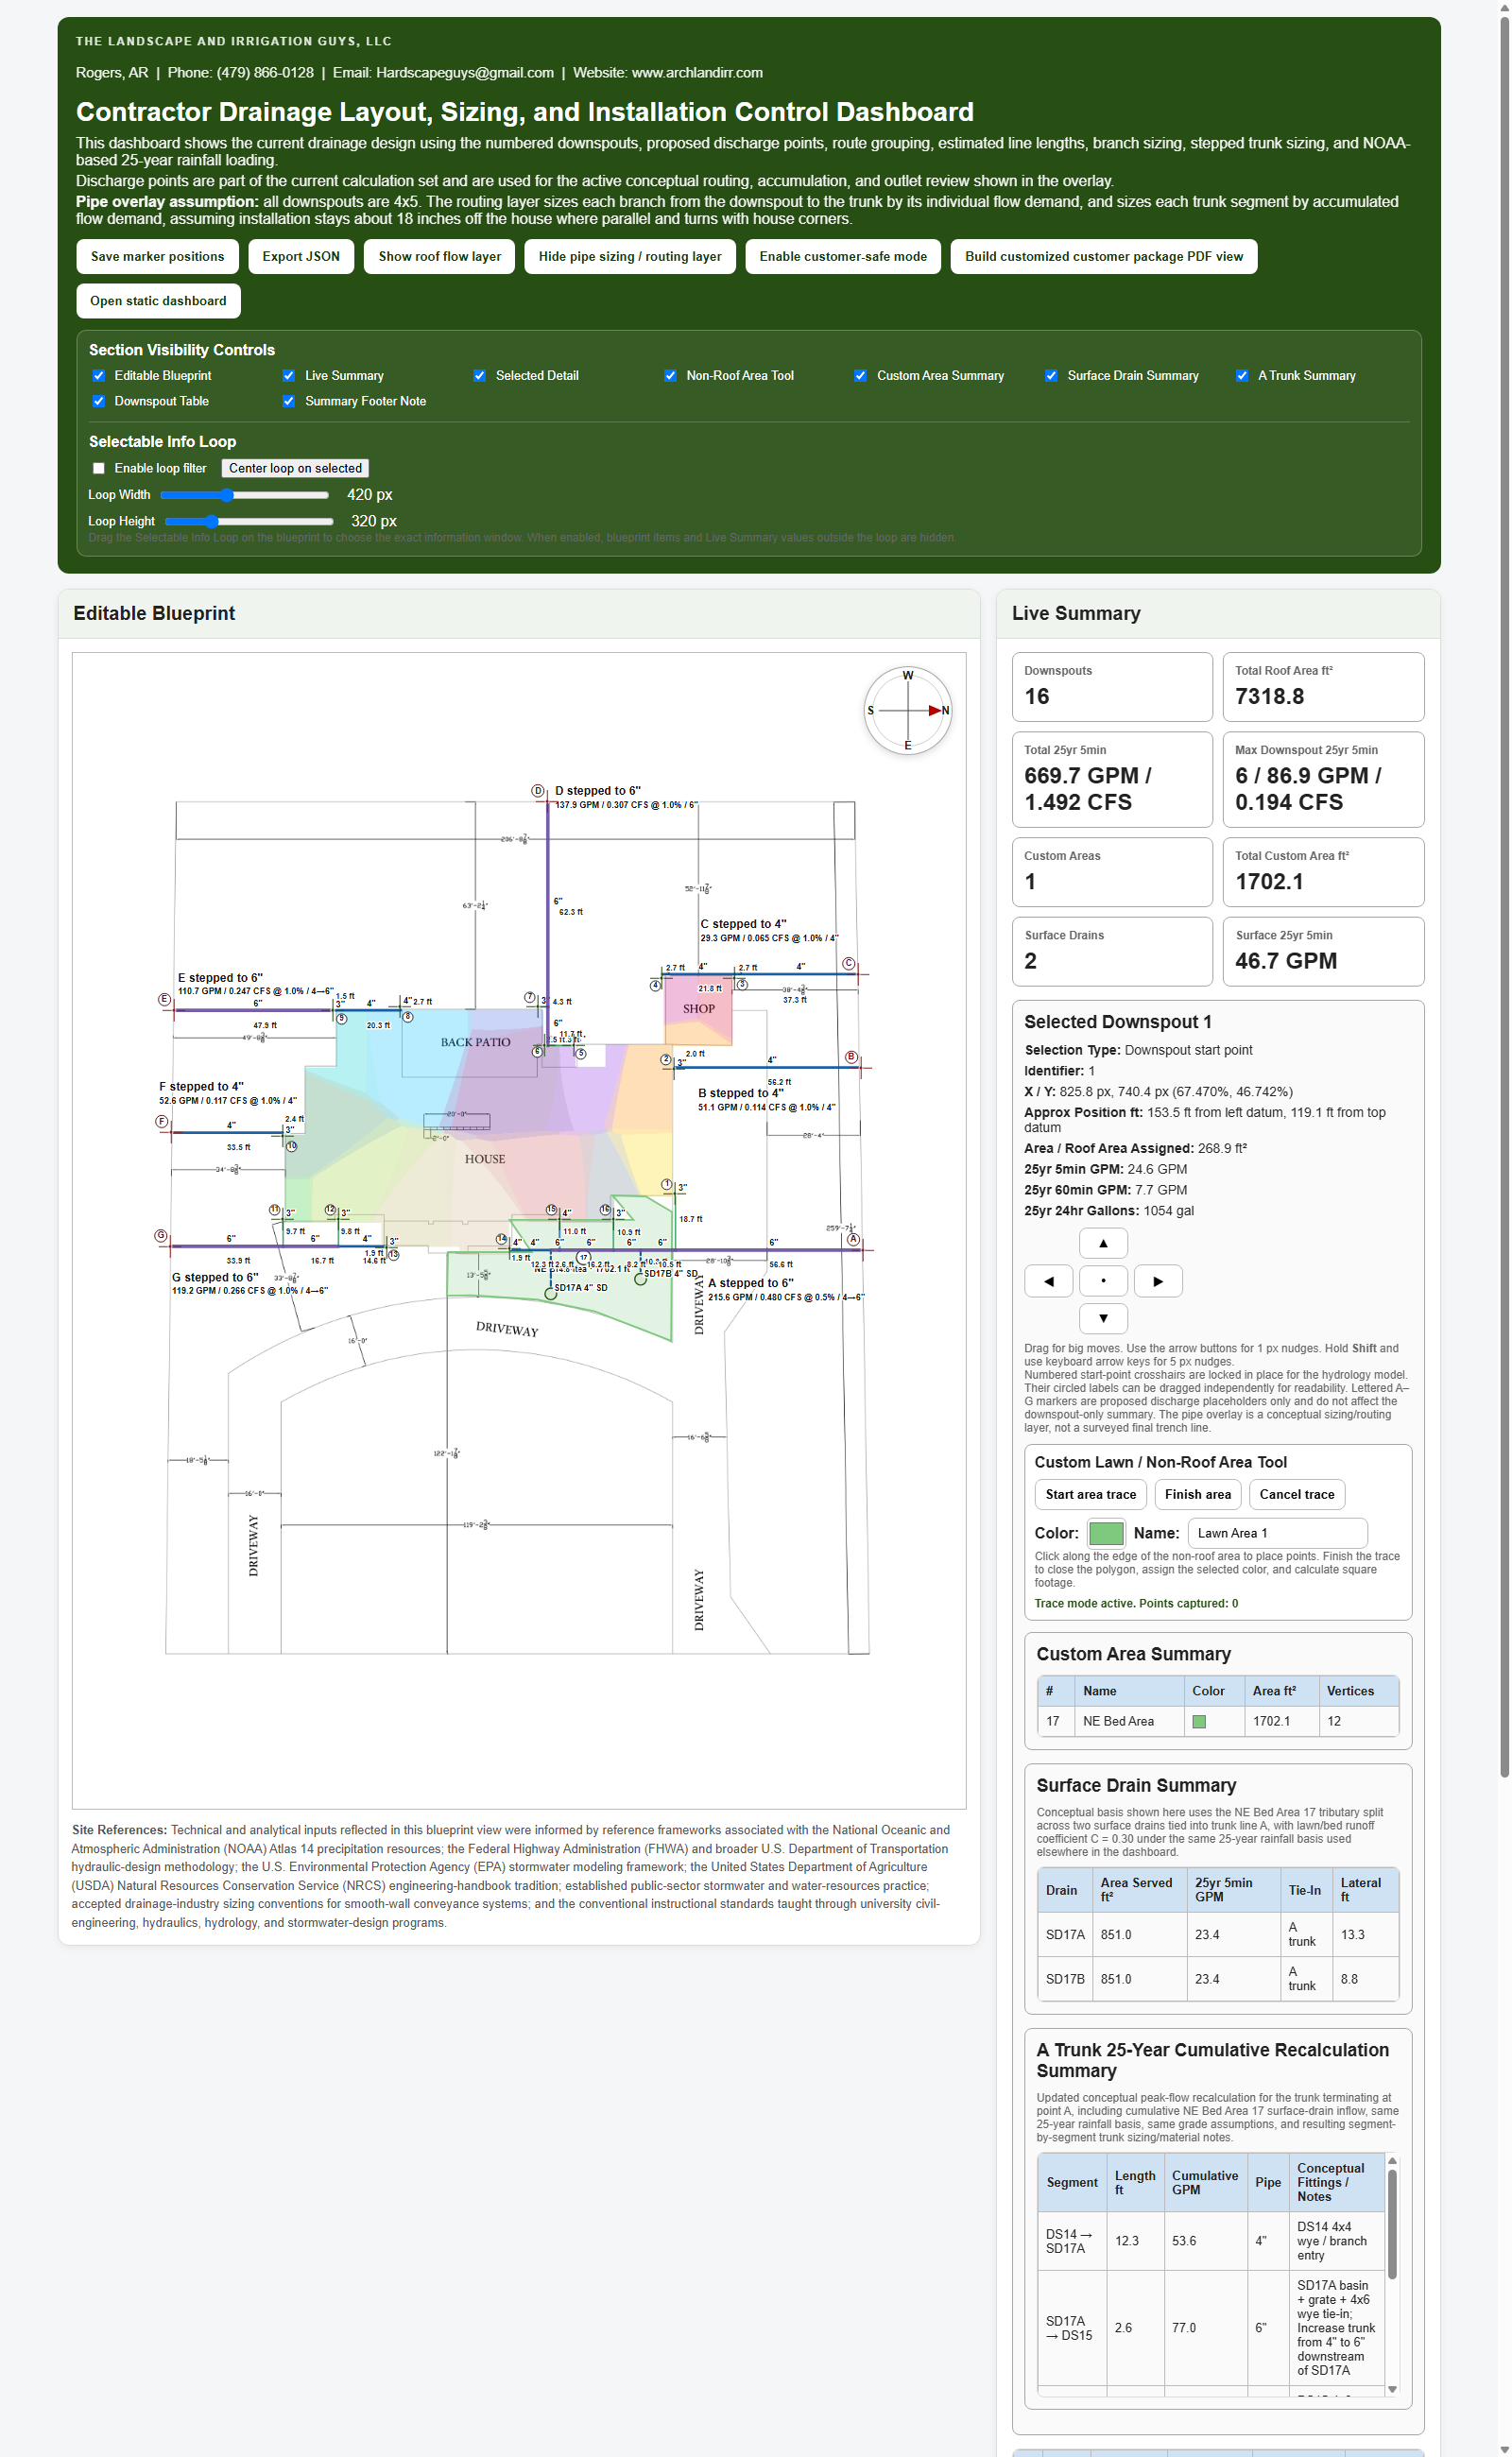
Why the Roof Had to Be Interpreted by Tributary Area

The drainage system does not experience “roof water” in the abstract. It experiences runoff arriving at specific entry points, from specific contributing roof areas and roof slopes, over specific storm durations. Tributary-area interpretation matters because different portions of the home create different burdens, and those burdens accumulate differently once they combine underground.

Why this matters to a homeownerNot every collection point is carrying the same responsibility. Some are relatively modest. Others become meaningful design drivers.
Why this matters to the installerOnce multiple entry points combine, route selection, grade discipline, and pipe sizing stop being cosmetic decisions and start becoming performance decisions.
Why this mattersA lower bid may still be acceptable — but only if it is based on a correct understanding of the runoff burden the system is being asked to manage.
Roof flow overlay
Roof-flow overlay used to understand which portions of the home contribute runoff to which collection points.
Worked Example

A Taste of the Work — Downspout #8

DownspoutRoof Area ft²5-Min Storm1-Hour Storm24-Hour Storm
DS081200.50.734 in in 5 min
109.9 GPM / 0.245 CFS
≈ 549.3 gal / 73.4 cu ft
2.76 in in 60 min
34.4 GPM avg / 0.077 CFS
≈ 2,065.5 gal / 276.1 cu ft
6.29 in in 24 hr
4,707 gal / 629.3 cu ft
3.27 GPM avg / 0.007 CFS
Why only one worked example is shownThis proves that the calculations were performed without disclosing the full proprietary design package.
Why this example is usefulDS08 is large enough to show how rainfall depth in inches becomes engineering burden in GPM, gallons, and cubic feet on a real portion of the pitch-adjusted roof model.
The homeowner gets proof of analytical discipline. Competitors do not receive the full set of design working papers for free.
Rainfall Basis

What the Rainfall Depths Mean in Practical Terms

0.734 inches in 5 minutesThis is the short-burst check. It asks what happens when water arrives quickly and aggressively. On the full pitch-adjusted roof model, that benchmark equates to about 8.81 in/hr, 858.8 GPM, and 1.913 CFS.
2.76 inches in 60 minutesThis is the sustained heavy-rain check. It asks what happens when the roof keeps feeding the system for a meaningful period. On the full pitch-adjusted roof model, that benchmark equates to about 269.0 GPM and 0.599 CFS average.
6.29 inches in 24 hoursThis is the full-day storm-volume check. It asks what total burden the property may have to live through in a major event. On the full pitch-adjusted roof model, that benchmark equates to about 36,799 gallons, 4,919.3 cubic feet, and 25.6 GPM / 0.057 CFS average.
Why the customer should careThe homeowner experiences the storm in inches. The buried system experiences the same storm as accumulated water burden. Good drainage planning connects those two realities correctly.
Why inches of rain are shown hereAlthough the underlying calculations are developed from a more technical hydraulic perspective, inches-of-rain examples are included so the customer can readily grasp the burden being discussed.
Why professional units are also shownFor technical review, the same rainfall burden is also expressed in the units used to evaluate the final design calculations, including intensity, gallons, cubic feet, GPM, and CFS.
Why the contractor should careIf the rainfall depth is misunderstood, everything downstream can be misunderstood as well: pipe choice, routing, fall, and outlet performance.
Technical Method

How the Recommendation Was Built Without Guesswork

Hydrology

Step 1: identify the contributing roof area associated with each collection point.

Step 2: apply local rainfall depth in inches over the relevant storm duration, then convert that depth to intensity, volume, and flow-rate equivalents as needed.

Step 3: convert plan-view catchment to estimated sloped roof area where pitch differs, then translate those inches into practical water burden for comparison, grouping, and pipe checking in gallons, cubic feet, GPM, and CFS.

Runoff assumption used: roof coefficient = 1.00, applied to pitch-adjusted roof area by roof section.

Hydraulics

Slope % = fall ÷ run × 100

Required fall was checked against route length and geometry.

Pipe capacity was evaluated behind the scenes so the recommendation would be technically defensible, not merely visually tidy.

Manning roughness used: n = 0.009 for smooth-wall sewer-and-drain assumptions.

The homeowner does not need the full engineering packet to understand the core point: measured roof area, photo-informed roof-pitch adjustment, real local rainfall, and gravity constraints create a design burden that should be checked before installation.
System-Level Grouping

How the Roof Was Organized Into Practical Route Systems

SystemGrade %Connected Roof Area ft²0.734 in / 5 min5-min Flow6.29 in / 24 hrFarthest Fall In
System 11.0337.4154.4 gal
20.6 cu ft
30.8 GPM
0.069 CFS
1323.0 gal
176.9 cu ft · 0.92 GPM avg / 0.002 CFS
7.42
System 21.0671.7307.3 gal
41.1 cu ft
61.5 GPM
0.137 CFS
2634.0 gal
352.1 cu ft · 1.83 GPM avg / 0.004 CFS
6.98
System 31.0690.6316.0 gal
42.2 cu ft
63.2 GPM
0.141 CFS
2708.0 gal
362.0 cu ft · 1.88 GPM avg / 0.004 CFS
4.31
System 41.01460.4668.2 gal
89.3 cu ft
133.6 GPM
0.298 CFS
5726.0 gal
765.5 cu ft · 3.98 GPM avg / 0.009 CFS
8.05
System 51.01546.1707.4 gal
94.6 cu ft
141.5 GPM
0.315 CFS
6062.0 gal
810.4 cu ft · 4.21 GPM avg / 0.009 CFS
8.51
System 61.02067.9946.2 gal
126.5 cu ft
189.3 GPM
0.422 CFS
8109.0 gal
1084.1 cu ft · 5.63 GPM avg / 0.013 CFS
10.00
System 70.52610.81194.6 gal
159.7 cu ft
238.9 GPM
0.532 CFS
10237.0 gal
1368.6 cu ft · 7.11 GPM avg / 0.016 CFS
6.50
This table demonstrates that grouped route analysis was performed, while intentionally withholding the full proprietary downspout-to-system assignment details.
Burden Comparison

Why Some Parts of the System Stay Modest While Others Become Serious

Example SystemConnected Roof Area ft²5-min Flow @ 0.734 in24-hr burden @ 6.29 inPlanning Interpretation
Light Example337.430.8 GPM / 0.069 CFS1323.0 gal / 176.9 cu ft
0.92 GPM avg / 0.002 CFS
Lighter route burden
Moderate Example671.761.5 GPM / 0.137 CFS2634.0 gal / 352.1 cu ft
1.83 GPM avg / 0.004 CFS
Moderate single-point burden
Heavy Example1546.1141.5 GPM / 0.315 CFS6062.0 gal / 810.4 cu ft
4.21 GPM avg / 0.009 CFS
Heavy combined route burden
Very Heavy Example2610.8238.9 GPM / 0.532 CFS10237.0 gal / 1368.6 cu ft
7.11 GPM avg / 0.016 CFS
Very heavy trunk burden
Same storm, different resultThe rainfall depth is the same across the property. What changes is how much roof is feeding a given route and how that route is organized.
Why pipe size changesOnce roof area and accumulated burden increase, comfortable pipe-selection territory changes with it.
Why this matters commerciallyOne-size-fits-all proposals can look simple and inexpensive at first glance, but simplicity is not the same thing as adequacy.
What the homeowner should take awayThe right question is not “how much pipe is being sold?” It is “what burden is each part of the system actually expected to carry?”
Constructability

Why Good Design Still Has to Be Installed Correctly

A drainage system can be conceptually sound and still fail in the field if grade is not held, crossings are misplaced, trench elevations drift, or backfill discipline is poor. Underground work is unforgiving because many installation errors remain invisible until the next major storm.

  • grade near the home cannot be “close enough”
  • future driveway and sidewalk crossings must be set correctly before hardscape is poured
  • field checks have to be repeated as the route progresses
  • backfill can preserve or destroy carefully established fall
  • maintenance access matters because buried systems eventually need service
Property layout reference
Property layout reference used to relate geometry, routing, and future flatwork consequences back to the actual site.
Execution Reality

What a Realistic Installation Schedule Looks Like

ScenarioEstimated Man-Hours3-Person Crew DaysMeaning
Best-case favorable production140.45.9Possible if conditions stay unusually favorable
Likely planning basis166.76.9Most realistic homeowner expectation
Still-sane contingency200.58.4Reasonable if field friction develops
What this means practicallyA normal three-person crew should think in terms of roughly one active work week, plus contingency — not unrealistic installation speed.
Why timing mattersCompressed schedules often mean skipped checks, weaker grade control, rougher transitions, and poorer finish quality.
What the homeowner is really buyingNot merely labor hours, but disciplined execution with enough time to do the buried work correctly.
Risk and Reliability

How Drainage Systems Usually Fail

Most drainage failures do not announce themselves on day one. They reveal themselves later, usually under meaningful rainfall, after the trench is closed and correction becomes much more expensive.

  • flat or backfall segments that quietly hold water
  • undersized trunk sections that surcharge under combined loading
  • outlets that are poorly chosen or poorly approached
  • fitting losses and transitions ignored during layout
  • future slab or driveway crossings set at the wrong elevation
  • a system that appears acceptable in light rain but underperforms when it actually matters
Analysis context
The value of planning is not pretty paperwork. The value is reducing the probability that buried work has to be excavated again later.
Contractor Evaluation

Questions Worth Asking Before Selecting a Contractor

Can the contractor explain the runoff burden?If not, the proposal may be based on habit rather than understanding.
Can the contractor explain grade and available fall?If not, the system may be relying on confidence rather than geometry.
Can the contractor explain why some sections are more serious than others?If not, pipe-selection logic may be weak or generic.
Can the contractor explain outlet logic and route control?The whole system depends on where the water is expected to leave the property and how it gets there.
Can the contractor explain installation sequence?Crossings, trench control, and protection of future flatwork are execution issues, not details to be figured out later.
Can the contractor explain serviceability?A buried system should not become an invisible liability that cannot be maintained later.
Pricing Context

Why the Price Range Is Wide — and Why That Is Not Automatically Bad

Lower planning basis$21,056 approximately, including labor, materials, equipment/support usage, and ordinary contractor management/risk allowance.
Design-informed revision contextThe revised layout reflects refined pipe sizing, simplified routing where appropriate, and continued attention to system burden, installation planning, and design discipline — the same standard of work that defines The Landscape and Irrigation Guys as the premier industry leader in Northwest Arkansas.
Higher planning basis$40,196 approximately, including labor, materials, equipment/support usage, and contractor management/risk allowance.
What the spread usually reflectsDifferences in current layout conditions and execution assumptions, including whether the property involves existing sod, fences, landscape-lighting wiring, landscape beds, irrigation, decks, patios, pool equipment and drains, utilities, or septic-system conflicts, along with differences in labor discipline, supplier timing, contingency tolerance, field-correction exposure, and how seriously the installer treats hidden error.
What the spread does not automatically meanA higher number is not automatically better, and a lower number is not automatically wrong. The real question is whether the scope, logic, and execution assumptions are defensible.
What the homeowner should watch forIf a bid is meaningfully less expensive, ask whether it is lower because the installer is efficient, because fewer obstacles are present — as is often the case in earlier phases of new-construction work — or because important buried risks have simply not been priced.
Closing

Final Summary

This project was evaluated through rainfall review, roof catchment analysis, grouped system logic, gravity feasibility, constructability review, and realistic execution planning. The goal was not to make the project appear complicated. The goal was to make the buried system more defensible, more reliable, and less vulnerable to preventable error.

The homeowner should expect a drainage solution that is not only installed neatly, but also thought through before the first trench is ever cut.

The final decision is straightforward: choose the contractor who can explain the rainfall, explain the burden, explain the route, explain the grade, and then execute the work with the same discipline used in the explanation. That is the standard The Landscape and Irrigation Guys brings as the premier industry leader in Northwest Arkansas.

Goal: protect the structure, reduce water risk, and avoid paying twice for buried mistakes.